CI/CD pipelines rarely get slow all at once. A new task adds a few seconds. A dependency download takes a bit longer. A sequence of tests retries more often. Weeks later, the pipeline is noticeably slower and no one knows when it started, or what changed to make it slow.
Even worse, looking at a single run doesn’t help in isolation. A task taking 90 seconds might look fine, unless it usually takes 20!
Understanding CI/CD performance requires history. You need to see how runs behave over time, which tasks gradually slow down, and when a regression first appears.
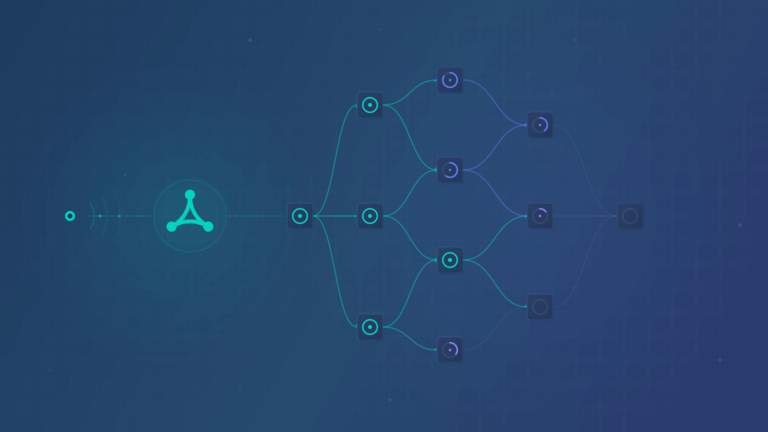
Today, we’re releasing zero-configuration OpenTelemetry tracing for CI/CD.
OpenTelemetry makes your traces portable by design. You can send your RWX data to any compatible back-end, keep it alongside your other observability information, and even switch between observability tools without re-instrumenting your pipelines.
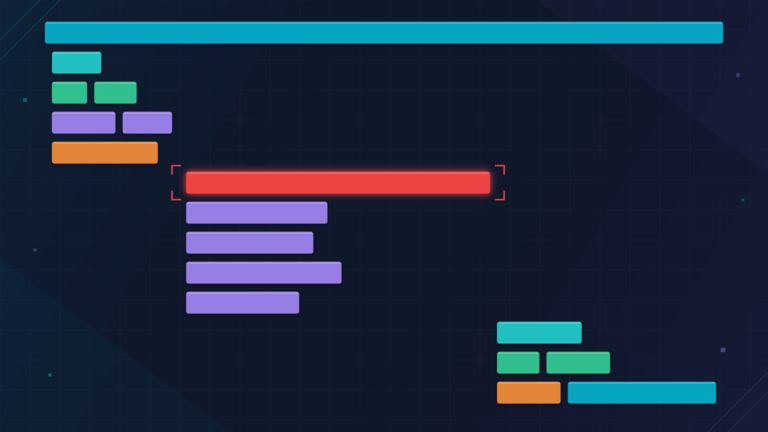
With traces flowing into your observability tool, you can compare the same task across all recorded runs and see exactly when it started getting slower, with real historical context.
There’s nothing to add to your RWX config, nothing to install. Provide your observability tool's credentials once and we’ll start sending traces.
CI/CD performance shouldn’t degrade quietly. Now it doesn’t have to!
Related posts

Unlock agent-native CI/CD with the RWX Skill
RWX has launched an official skill for working with the RWX CLI and run definition files.

Trigger runs via Webhook
You can now trigger RWX runs from webhooks from third-party services. This is helpful for using RWX to run custom automation.

